Expected Data Format
Time series data, or Time-stamped data, is a sequence of measurement data with respect to their time of occurrence. For any types of machine learning time series tasks, getting the correct data format is important. Below, we illustrate the correct time series data format based on different tasks.
Time Series Forecasting
Required Format
The required input data format is a two-dimensional structure (pandas.DataFrame), which should contain a timestamp column (time_col) and one or more variable columns (var_col_0, var_col_1, var_col_2,… var_col_n,). See example below:
    time_col          var_col_0        var_col_1        var_col_2     ...    var_col_n
xxxx-xx-xx xx:xx:xx        x                x                x                    x
xxxx-xx-xx xx:xx:xx        x                x                x                    -
xxxx-xx-xx xx:xx:xx        x                x                x                    x
xxxx-xx-xx xx:xx:xx        -                x                x                    x
xxxx-xx-xx xx:xx:xx        x                x                x                    x
xxxx-xx-xx xx:xx:xx        x                -                x                    x
xxxx-xx-xx xx:xx:xx        x                -                x                    x
xxxx-xx-xx xx:xx:xx        x                x                -                    x
xxxx-xx-xx xx:xx:xx        x                x                x                    x
xxxx-xx-xx xx:xx:xx        x                x                -                    x
xxxx-xx-xx xx:xx:xx        -                -                -                    -
xxxx-xx-xx xx:xx:xx        x                x                x                    x
        -                  -                -                -                    -
xxxx-xx-xx xx:xx:xx        x                x                x                    x
where xxxx-xx-xx xx:xx:xx stands for the datetime. Preferably, the date format is YYYY-MM-DD and the time is HH:MM:SS. In variable columns, (x) represents a certain value and (-) means the value is missing.
Note
The timestamp column is mandatory for forecasting task. However, the column name is free to define.
The datetime can be any format as long as it can be identified by
pandas.to_datetime.HyperTS could sort the data in time sequence if the timestamps of original input data are random.
HyperTS supports input data with various time frequencies. For example, second(S)、minute(T)、hour(H)、day(D)、week(W)、month(M)、year(Y), etc.
HyperTS could impute the missing time segments and missing values during the preprocessing stage.
HyperTS could dropout the repeated rows during the preprocessing stage.
Sometimes, there are extra variables generated during the processing, which are called covariates. They will be added parallel to the input variables. See example below:
    time_col          var_col_0   var_col_1 ... var_col_n   covar_col_0    covar_col_1 ... covar_col_m
xxxx-xx-xx xx:xx:xx        x          x              x            x              x               x
xxxx-xx-xx xx:xx:xx        x          x              -            x              x               x
xxxx-xx-xx xx:xx:xx        x          x              x            x              -               x
xxxx-xx-xx xx:xx:xx        -          x              x            x              x               -
xxxx-xx-xx xx:xx:xx        x          x              x            x              x               x
xxxx-xx-xx xx:xx:xx        x          -              x            x              x               x
xxxx-xx-xx xx:xx:xx        x          -              x            x              x               x
xxxx-xx-xx xx:xx:xx        x          x              x            x              -               x
xxxx-xx-xx xx:xx:xx        x          x              x            x              x               x
xxxx-xx-xx xx:xx:xx        x          x              x            x              x               x
xxxx-xx-xx xx:xx:xx        -          -              -            x              x               x
xxxx-xx-xx xx:xx:xx        x          x              x            x              x               x
        -                  -          -              -            -              -               -
xxxx-xx-xx xx:xx:xx        x          x              x            x              x               x
where covar_col_1,…, covar_col_m are covariates.
Note
Covariates could be continuous or discrete(categorical) values.
Covariates could contain repeated or missing values.
Examples
Let’s generate a random dataset without covariates.
import numpy as np
import pandas as pd

size=5

df_no_covariate = pd.DataFrame({
    'timestamp': pd.date_range(start='2022-02-01',  periods=5,  freq='H'),
    'val_0': np.random.normal(size=size),
    'val_1': [0.5,  0.2,  np.nan,  0.9,  0.0],
    'val_2': np.random.normal(size=size),
})

df_no_covariate
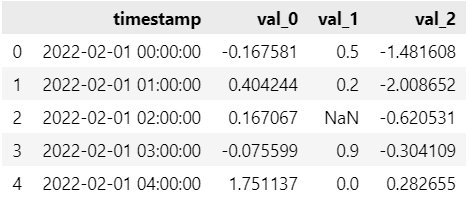
The output shows that:
The name of the timestamp column is ‘timestamp’;
The names of the target columns are ‘var_0’, ‘var_1’, ‘var_2’;
The time frequency is per hour: ‘H’;
The dataset contains missing values;
It’s a multivariate timeseries forecasting task.
Let’s generate a random dataset with covariates.
df_with_covariate = pd.DataFrame({
    'timestamp': pd.date_range(start='2022-02-01',  periods=size,  freq='D'),
    'val_0': np.random.normal(size=size),
    'val_1': [12,  52,  34,  np.nan,  100],
    'val_2': [0.5,  0.2,  np.nan,  0.9,  0.0],
    'covar_0': [0.2,  0.4,  0.2,  0.7,  0.1],
    'covar_1': ['a',  'a',  'b',  'b',  'b'],
    'covar_2': [1,  2,  2,  None,  3],
})

df_with_covariate
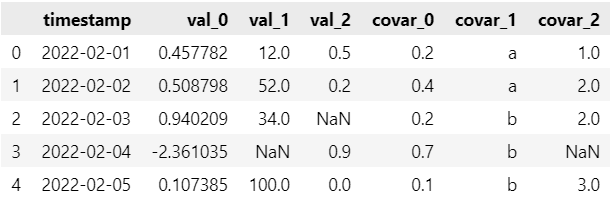
The output shows that:
The name of the timestamp column is ‘timestamp’;
The names of the target columns are ‘var_0’, ‘var_1’, ‘var_2’;
The names of the covariates columns are ‘covar_0’, ‘covar_1’, ‘covar_2’;
The time frequency is per day: ‘D’;
The dataset contains missing values;
It’s a multivariate timeseries forecasting task.
Time Series Classification and Regression
Required Format
Differing from the forecasting tasks, the input data for classification and regression tasks are nested DataFrame, which means the variations over a time segment are listed in one cell. See example below.
   var_col_0           var_col_1           var_col_2      ...      var_col_n       target
x, x, x, ..., x     x, x, x, ..., x     x, x, x, ..., x         x, x, x, ..., x      y
x, x, x, ..., x     x, x, x, ..., x     x, x, x, ..., x         x, x, x, ..., x      y
x, x, x, ..., x     x, x, x, ..., x     x, x, x, ..., x         x, x, x, ..., x      y
x, x, x, ..., x     x, x, x, ..., x     x, x, x, ..., x         x, x, x, ..., x      y
x, x, x, ..., x     x, x, x, ..., x     x, x, x, ..., x         x, x, x, ..., x      y
x, x, x, ..., x     x, x, x, ..., x     x, x, x, ..., x         x, x, x, ..., x      y
x, x, x, ..., x     x, x, x, ..., x     x, x, x, ..., x         x, x, x, ..., x      y
x, x, x, ..., x     x, x, x, ..., x     x, x, x, ..., x         x, x, x, ..., x      y
x, x, x, ..., x     x, x, x, ..., x     x, x, x, ..., x         x, x, x, ..., x      y
Every row stands for one sample data, which has n+1 feature variables. The observations x, x, x, …, x of one variable (var_col_0) over a time period are listed in one cell (the top-left). Target y represents the label of the sample.
Note
The main difference between the forecasting and classification/regression data format is the representation of time sequence. For forecasting task, the time-stamped data are listed in one column. However, for classification/regression, the time-stamped data are squeezed in one cell. By doing this, the DataFrame could contain more samples in rows. And the sample labels y are listed in the
targetcolumn.The
pandas.DataFrameis apparently a two-dimensional table. However, it’s actually a three-dimensional data, since each cell stores a time series data. That’s why we called it as nested DataFrame.For classification/regression tasks, the trends between samples are key features. Therefore, the TimeStamp information are ignored to simplify the process.
Example
Let’s generate a random dataset for time series classification.
import numpy as np
import pandas as pd

size=10

df = pd.DataFrame({
    'var_0': [pd.Series(np.random.normal(size=size)),  pd.Series(np.random.normal(size=size)),
              pd.Series(np.random.normal(size=size)),  pd.Series(np.random.normal(size=size)),
              pd.Series(np.random.normal(size=size)),  pd.Series(np.random.normal(size=size))],
    'var_1': [pd.Series(np.random.normal(size=size)),  pd.Series(np.random.normal(size=size)),
              pd.Series(np.random.normal(size=size)),  pd.Series(np.random.normal(size=size)),
              pd.Series(np.random.normal(size=size)),  pd.Series(np.random.normal(size=size))],
    'var_2': [pd.Series(np.random.normal(size=size)),  pd.Series(np.random.normal(size=size)),
              pd.Series(np.random.normal(size=size)),  pd.Series(np.random.normal(size=size)),
              pd.Series(np.random.normal(size=size)),  pd.Series(np.random.normal(size=size))],
    'y': [0,  0,  1,  1,  2,  2],
})

df
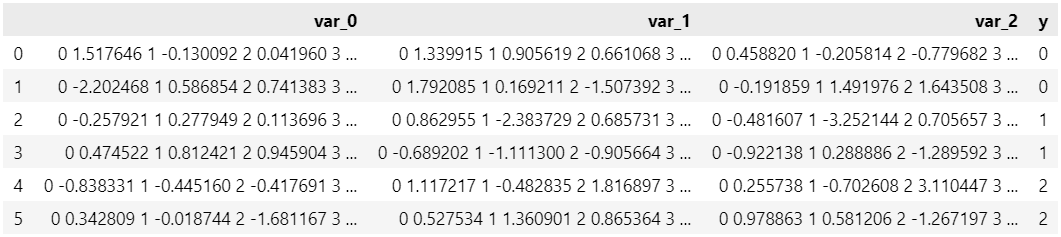
The output shows that:
The name of the target variable is ‘y’;
The names of the feature variables are ‘var_0’, ‘var_1’, ‘var_2’;
It’s a multivariate classification task.
Convert Array to Nested Dataframe
Normally, the acquired data is in the form of numpy.array. We need to convert them to the nested pandas.DataFrame. For example, we have the numpy data as below:
import numpy as np

nb_samples = 100
series_length = 72
nb_variables = 6
nb_classes = 4

X = np.random.normal(size=nb_samples*series_length*nb_variables).reshape(nb_samples,  series_length,  nb_variables)
y = np.random.randint(low=0,  high=nb_classes,  size=nb_samples)
print(X)

array([[[ 0.57815678,   0.41459846,  -0.50473205,  -1.99750872,
          1.4631261 ,  -1.93345998],
        [ 0.80831576,  -0.21562245,   1.29258974,   0.78233567,
          0.87576927,  -1.34082721],
        [ 0.41409349,   0.40804883,   0.96354344,   1.5678011 ,
          0.60987622,   0.28618276],
        ...,
        [-0.09893226,  -0.47034969,  -0.2822979 ,   1.41712479,
        -0.55125917,   1.38645133],
        [ 0.86447489,  -1.44334104,   0.38009615,   1.86328252,
          0.39575692,  -1.50915368],
        [ 0.49571136,   0.60916544,   1.34735049,   1.14492395,
        -1.01143839,   0.06649033]],
        ...

print(y)

array([0,  1,  0,  1,  1,  1,  3,  0,  2,  2,  0,  0,  3,  0,  2,  1,  3,  0,  1,  3,  3,  1,
      1,  1,  1,  2,  3,  3,  3,  3,  3,  3,  1,  2,  1,  2,  1,  3,  1,  3,  0,  1,  1,  2,
      3,  3,  2,  2,  3,  1,  2,  0,  0,  0,  0,  3,  1,  3,  3,  0,  3,  3,  3,  1,  2,  2,
      2,  1,  2,  0,  0,  1,  3,  1,  1,  3,  2,  1,  1,  3,  2,  1,  2,  2,  3,  0,  2,  2,
      3,  1,  0,  2,  2,  1,  1,  1,  0,  0,  1,  1])
This dataset contains 100 samples. Each sample has 6 feature variables. And each variable has measurement data taken at 72 time indices. The target variable y has 4 categories.
HyperTS provides a function from_3d_array_to_nested_df, that could automatically convert 3d array to required nested dataframe. See example below:
import pandas as pd
from hyperts.toolbox import from_3d_array_to_nested_df

df_X = from_3d_array_to_nested_df(data=X)
df_y = pd.DataFrame({'y': y})
df = pd.concat([df_X,  df_y],  axis=1)

df.head()

Time Series Anomaly Detection
Similar to forecasting, the required input data format is a two-dimensional structure (pandas.DataFrame), which should contain a TimeStamp column (time_col) ,one or more variable columns (var_col_0, var_col_1, var_col_2,… var_col_n). And sometimes, one or more covariates columns (covar_col_0, covar_col_1, covar_col_2,… covar_col_m). See example below:
xxxx-xx-xx xx:xx:xx x x x x x x xxxx-xx-xx xx:xx:xx x x - x x x xxxx-xx-xx xx:xx:xx x x x x - x xxxx-xx-xx xx:xx:xx - x x x x - xxxx-xx-xx xx:xx:xx x x x x x x xxxx-xx-xx xx:xx:xx x - x x x x xxxx-xx-xx xx:xx:xx x - x x x x xxxx-xx-xx xx:xx:xx x x x x - x xxxx-xx-xx xx:xx:xx x x x x x x xxxx-xx-xx xx:xx:xx x x x x x x xxxx-xx-xx xx:xx:xx - - - x x x xxxx-xx-xx xx:xx:xx x x x x x x
xxxx-xx-xx xx:xx:xx x x x x x x ```
In addition, the above data can also contain ground truth, which will help in model selection and hyperparameter search. The format is as follow:
    time_col          var_col_0   var_col_1 ... var_col_n   covar_col_0    covar_col_1 ... covar_col_m   anomaly
xxxx-xx-xx xx:xx:xx        x          x              x            x              x               x          1
xxxx-xx-xx xx:xx:xx        x          x              -            x              x               x          0
xxxx-xx-xx xx:xx:xx        x          x              x            x              -               x          0
xxxx-xx-xx xx:xx:xx        -          x              x            x              x               -          1
xxxx-xx-xx xx:xx:xx        x          x              x            x              x               x          0
xxxx-xx-xx xx:xx:xx        x          -              x            x              x               x          0
xxxx-xx-xx xx:xx:xx        x          -              x            x              x               x          0
xxxx-xx-xx xx:xx:xx        x          x              x            x              -               x          0
xxxx-xx-xx xx:xx:xx        x          x              x            x              x               x          1
xxxx-xx-xx xx:xx:xx        x          x              x            x              x               x          0
xxxx-xx-xx xx:xx:xx        -          -              -            x              x               x          0
xxxx-xx-xx xx:xx:xx        x          x              x            x              x               x          0
        -                  -          -              -            -              -               -          1
xxxx-xx-xx xx:xx:xx        x          x              x            x              x               x          0
where anomaly is anomaly label column.
Note
When the data has ground truth label, the optimization evalution uses the ground truth. Otherwise, the generated pseudo-label is applied.